
This is the third blog in a 4-part series that focuses on whiteboarding. Part 1 outlined the benefits of whiteboarding. Part 2 provided some hands-on drawing exercises to build skills and confidence. Now we’ll learn about different types of diagrams to use when you’re simultaneously learning and capturing information.
In our work, we often meet with companies trying to understand the specifics of how their operations work, who is involved, what their key concepts are and how they map out, and what unique value and experiences they provide for customers and employees. There’s a big world of diagrams to choose from, but here I’ll focus on 5 types—your starter set.
Process and Flow Maps—Whether you are trying to understand how car repair shops work or how customized drinkware is sold and delivered, there are standard elements for mapping a process. A process map is typically shown from a company’s perspective and includes the following:
- The primary steps and their sequence
- Activities within each step
- Any loops in the process
- Major decision points or branches
- People involved at each step in the process
I typically map out high-level steps as a first pass to get an understanding of the end-to-end process. It can be difficult to manage your time in a discussion without knowing the beginning and the end (and some idea of what’s in between).
Below is a diagram of how a construction company handles inbound sales opportunities. The major steps and flow are the foundation, and people and issues can be layered on as the conversation unfolds.
If it helps, I think of these diagrams as “how things were designed to work” in contrast to “how things really go down in real life” which can be captured through a Journey Map (which is up next). I often imagine process diagrams being narrated by Morgan Freeman in sort of a “how to” style. Is that weird?
Now, try mapping a process on your own. Here are a few ideas:
- How to paint a room
- Going in for a minor procedure at a hospital
- Taking a plane trip (with a layover!)
- Cooking a meal (choosing, shopping, preparing, serving...)
- Arranging dinner with friends
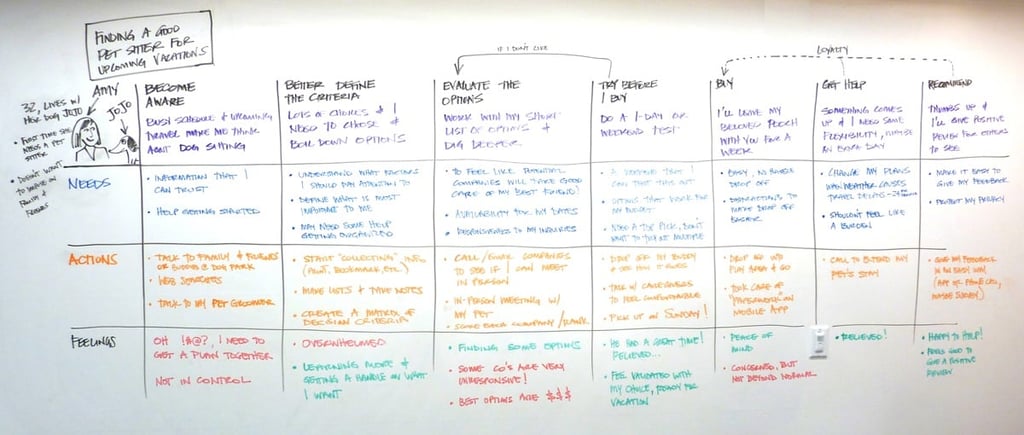
Journey Map—A journey map has some similarities to a process map, but it is different in one important way: it is created from the customer’s point of view. A map of a journey chronicles what a specific customer or customer type does and is ideally based upon data and/or research. It is one story, not a map of all possible permutations.
Journey maps typically contain the following elements:
- Stages of the Journey
- Actions
- Touchpoints with your company (but not limited to them)
- Thoughts
- Feelings
- Opportunities
Below is a journey map for Amy that captures how she becomes aware of her need to find a pet sitter or kennel and the steps in her experience. Different dimensions of her journey are outlined including her needs, actions taken and her emotions. These have been color coded in this diagram to help differentiate them. These are a good starting point, but you can also choose other dimensions like time, pain points, people and technology or tools that are most relevant for your conversation.
Yep. It’s your turn again. Take a crack at creating a journey map. Here are a few options or invent one of your own:
- Jenni, an early 20’s woman applying for her second job (while still working at her first job... gasp!)
- Frank, a 67 year-old retiree setting up his new fitness tracking bracelet
- Daniel, a 35 year old who has just moved to the area wants to find volunteering opportnities as a way to meet new friends
- Wanda, a 40 year old single mom-to-be who has to prepare her house for her first child
Make the journey for these people, but try to capture the elements listed above. Have fun with it. Remember, the goal is to better understand the world through their eyes and empathize with them and their situation. It’s important to include all of their actions, not just when they interact with your company (or the company you’re working with).
Concept Map—Concept maps are a visual organizer for a subject, a visual description to help someone new understand the topic. A concept map starts with the main idea (or concept), branches out to capture other sub-concepts and then drills down into more detail. Words on a line connect the concepts and communicate their relationships. Concept maps are not just a great way to capture and learn about a new domain, but also to engage subject matter experts who can make sure that the right terms are used and that relationships are accurate and complete.
Below is a diagram of the information related to a kennel business that captures important dimensions in black. The information about Amy, her pets and her needs is layered on in green.
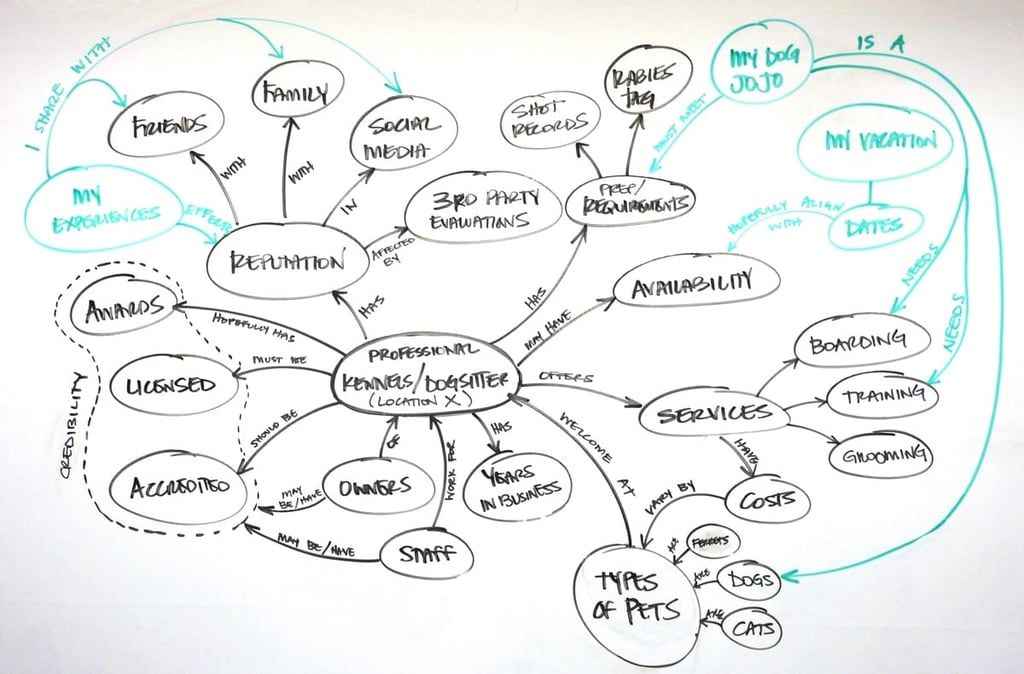
Product attributes and options, content that a company shares with its customers, and taxonomies of animals and plants are just a few examples of subjects that you could diagram with a concept map. It’s helpful to have a purpose in mind. Without some boundaries, you can easily take on a topic that gets too large to map.
If you want to try a concept map of your own, here are a few ideas and a handful of dimensions to get you going:
- Your music preferences (genres, generations, genders, moods, time of day, alone/social/location)
- Varieties of wine (origins, cheese pairings, white/red, grapes, boxed/bottled)
- Kinds of footwear (temperature, activity types, costs, materials,...)
- Candy (texture, color, size, cost, tastes, memories, brand name/bulk)
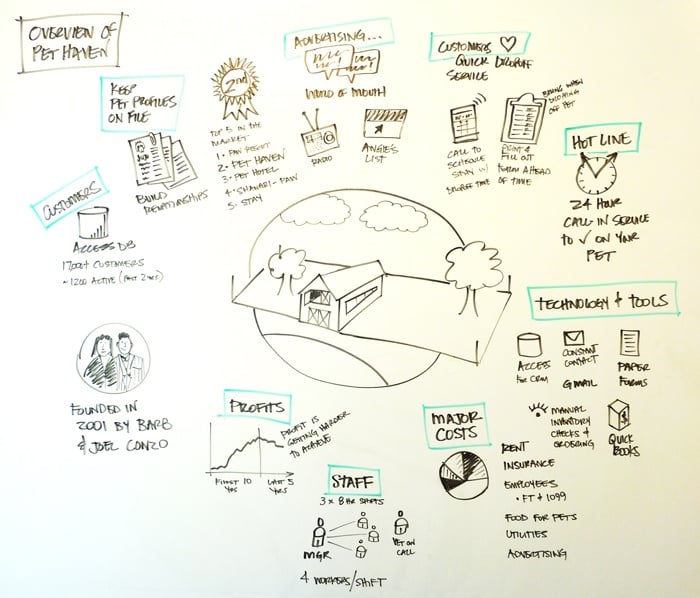
Business Overview—I’m often in workshops to start a project with a new client. These companies frequently come in with an idea in mind like “we need to improve our customer service experience” or “we need to engage our customers using mobile.” With such a sharp focus, it can take some work to get the group to zoom out a bit, but it’s important to first get a sense of the context by talking about the business. Business Context diagrams typically capture a wide variety of high-level information about the company (too many to list here), but often include information about:
- Customer types
- Products and services
- Distribution channels
- Operational areas (brand, marketing, sales, product/service design, manufacturing, distribution, customer service, etc.)
- Locations
We discuss many other important things that don’t fit neatly into a diagram such as sales figures, competitors and follow up actions. Just put them on the side, and keep up with the conversation. You can revisit later to find a way to integrate them.
Below is an overview of Pet Haven Kennels. The top half captures information about their customers, their image and the customer experience. The bottom half is more internally focused with information about operations, profits, technology and staffing.
To create a diagram like this, consider talking to a friend or relative and have them describe a business while you draw it. Some possibilities:
- The company you work for
- Amazon (or some other well-known business that you know a lot about)
- A volunteer organization
- A club
Cool and relevant links, Part 3:
- Mapping Experiences—A great reference book by O’Reilly with a variety of diagram types that dives deeper into the contexts in which they can be used. While not specifically about whiteboarding, the diagrams can serve as reference patterns when you’re ready to move beyond the starter set above.
- Value Proposition Design—A good tool for not only articulating key aspects new products and services, but also understanding existing ones. The approach has two central diagram types that are part of its “value proposition canvas” that are great patterns to consider using as you capture information about a company’s business model and customers.
- UX Journey Map Pins—Some example journey maps that show the variety of forms that these can take and may provide some inspiration.
Let us do the drawing for you.
Our experienced team of human-centered designers is ready to help you visualize your business challenges and customer needs like never before. Start your journey towards better business and more lucrative interactions between customers, partners and employees with Summa.